2025 Election Results and Returns
Official results for the Wellington Regional Council triennial elections 2025 are now available. All ordinary and special votes have been counted. Results are final. Voter turnout was 47.1%.
declaration of results
Wellington Regional Council Local Government Elections 2025 - Declaration of Result
date_range Published 18 Oct 2025
Download now (PDF 164 KB) get_appResults
| Candidate | Affiliation | Status |
| Penny Gaylor | Elected | |
| Sam Ferguson | Excluded |
| Candidate | Affiliation | Status |
| Simon Woolf | Independent | Elected |
| Daran Ponter | Labour | Elected |
| Yadana Saw | Green Party | Elected |
| Tom James | Labour | Elected |
| Sarah Free | Independent | Elected |
| Alice Claire Hurdle | ACT Local: Real Change. Lower Rates | Excluded |
| Tom Kay | Independent | Excluded |
| Glenda Hughes | Independent Former Councillor | Excluded |
| Henry Peach | Green Party | Excluded |
| Belinda McFadgen | Excluded | |
| Mark Kellynack | Independent | Excluded |
| Candidate | Affiliation | Status |
| Phil Rhodes | Elected | |
| Claire Johnstone | Independent | Elected |
| Hikitia Ropata | Independent | Excluded |
| Grenville Gaskell | Independent | Excluded |
| Daniel Hicks | Independent | Excluded |
| Candidate | Affiliation | Status |
| Quentin Duthie | Green Party | Elected |
| Gabriel Tupou | Independent | Elected |
| Nigel Elder | ACT Local: Real Change. Lower Rates. | Elected |
| Mike Fisher | Independent | Excluded |
| Mike Stevenson | Independent | Excluded |
| Matt Shand | Excluded | |
| Omar Faruque | Independent | Excluded |
| Tom Murphy | Independent | Excluded |
As the number of nominations received did not exceed the number of vacancies, Ros Connelly is elected unopposed.
As the number of nominations received did not exceed the number of vacancies, Shamia Makarini is elected unopposed.
| Candidate | Affiliation | Status |
| Adrienne Staples | Independent | Elected |
| Alistair Plimmer | Excluded |
Māori Constituency poll result
| Option | Votes received |
| I vote to KEEP the Māori Constituency | 109,644 |
| I vote to REMOVE the Māori Constituency | 63,029 |
The option to KEEP the Māori Constituency has received the most votes. The poll result is binding and will apply to Greater Wellington Regional Council elections held in 2028 and 2031.
Māori constituency poll result by city/district area
| City/District | Poll votes cast | Vote Keep | Vote Keep % | Vote Remove | Vote Remove % | Margin |
| Carterton District | 3,729 | 1,793 | 48.08 | 1,936 | 51.92 | (143) |
| Kāpiti Coast District | 18,558 | 10,582 | 57.02 | 7,976 | 42.98 | 2,606 |
| Lower Hutt City | 30,204 | 18,929 | 62.67 | 11,275 | 27.33 | 7,654 |
| Masterton District | 8,551 | 4,443 | 51.96 | 4,108 | 48.04 | 335 |
| Porirua City | 16,566 | 11,350 | 68.51 | 5,216 | 31.49 | 6,134 |
| South Wairarapa District | 5,029 | 2,793 | 55.54 | 2,236 | 44.46 | 557 |
| Upper Hutt City | 14,296 | 7,690 | 53.79 | 6,606 | 46.21 | 1,084 |
| Wellington City | 75,740 | 52,064 | 68.74 | 23,676 | 31.26 | 28,388 |
| WELLINGTON REGION | 172,673 | 109,644 | 63.50 | 63,029 | 36.50 | 46,615 |
A part of Tararua District falls within the Wellington Region. Relevant data for this small cohort is not available.
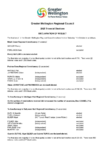
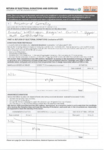
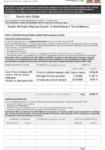
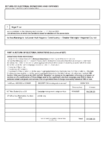
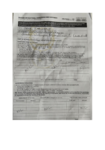
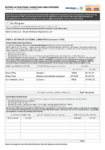
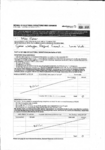
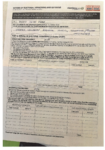
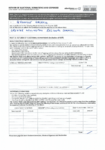
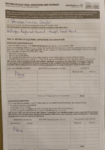
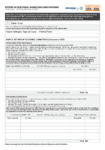
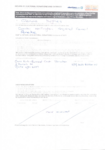
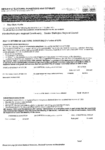
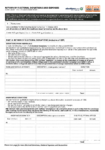
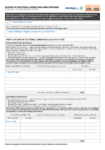
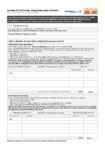
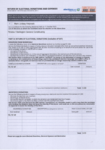
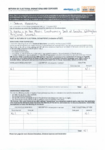
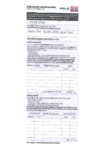
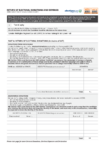
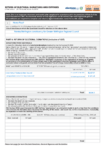
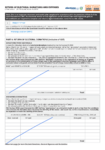
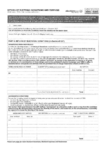
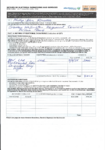
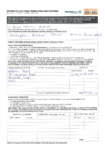
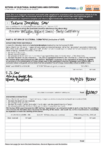
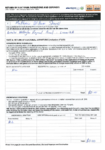
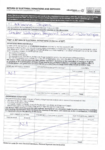
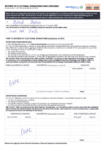
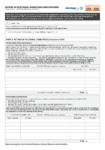
Candidate Returns of Electoral Donations and Expenses
Candidates are required to file a Return of donations received and expenses incurred for the election.
CONNELLY Ros Return of Electoral Donations and Expenses
date_range Published 12 Dec 2025
Download now (PDF 1.9 MB) get_appDUTHIE Quentin Return of Electoral Donations and Expenses
date_range Published 12 Dec 2025
Download now (PDF 1.3 MB) get_appELDER Nigel Return of Electoral Donations and Expenses
date_range Published 12 Dec 2025
Download now (PDF 164 KB) get_appFARQUE Omar Return of Electoral Donations and Expenses
date_range Published 12 Dec 2025
Download now (PDF 696 KB) get_appFERGUSON Sam Return of Electoral Donations and Expenses
date_range Published 12 Dec 2025
Download now (PDF 470 KB) get_appFISHER Mike Return of Electoral Donations and Expenses
date_range Published 12 Dec 2025
Download now (PDF 2.7 MB) get_appFREE Sarah Return of Electoral Donations and Expenses
date_range Published 12 Dec 2025
Download now (PDF 528 KB) get_appGASKELL Grenville Return of Electoral Donations and Expenses
date_range Published 12 Dec 2025
Download now (PDF 1.4 MB) get_appGAYLOR Penny Return of Electoral Donations and Expenses
date_range Published 12 Dec 2025
Download now (PDF 5.4 MB) get_appHICKS Daniel Return of Electoral Donations and Expenses
date_range Published 12 Dec 2025
Download now (PDF 160 KB) get_appHUGHES Glenda Return of Electoral Donations and Expenses
date_range Published 12 Dec 2025
Download now (PDF 706 KB) get_appHURDLE Alice Return of Electoral Donations and Expenses
date_range Published 12 Dec 2025
Download now (PDF 660 KB) get_appJAMES Tom Return of Electoral Donations and Expenses
date_range Published 12 Dec 2025
Download now (PDF 223 KB) get_appJOHNSTONE Claire Return of Electoral Donations and Expenses
date_range Published 12 Dec 2025
Download now (PDF 193 KB) get_appKAY Tom Return of Electoral Donations and Expenses
date_range Published 12 Dec 2025
Download now (PDF 130 KB) get_appKELYNACK Mark Return of Electoral Donations and Expenses
date_range Published 12 Dec 2025
Download now (PDF 3.2 MB) get_appMAKARINI Shamia Return of Electoral Donations and Expenses
date_range Published 12 Dec 2025
Download now (PDF 801 KB) get_appMCFADGEN Belinda Return of Electoral Donations and Expenses
date_range Published 12 Dec 2025
Download now (PDF 303 KB) get_appMURPHY Tom Return of Electoral Donations and Expenses
date_range Published 12 Dec 2025
Download now (PDF 113 KB) get_appPEACH Henry Return of Electoral Donations and Expenses
date_range Published 12 Dec 2025
Download now (PDF 692 KB) get_appPLIMMER Alistair Return of Electoral Donations and Expenses
date_range Published 12 Dec 2025
Download now (PDF 298 KB) get_appPONTER Daran Return of Electoral Donations and Expenses
date_range Published 12 Dec 2025
Download now (PDF 1.7 MB) get_appRHODES Phil Return of Electoral Donations and Expenses
date_range Published 12 Dec 2025
Download now (PDF 3.8 MB) get_appROPATA Hikitia Return of Electoral Donations and Expenses
date_range Published 12 Dec 2025
Download now (PDF 874 KB) get_appSAW Yadana Return of Electoral Donations and Expenses
date_range Published 12 Dec 2025
Download now (PDF 1.3 MB) get_appSHAND Matt Return of Electoral Donations and Expenses
date_range Published 12 Dec 2025
Download now (PDF 234 KB) get_appSTAPLES Adrienne Return of Electoral Donations and Expenses
date_range Published 12 Dec 2025
Download now (PDF 555 KB) get_appSTEVENSON Mike Return of Electoral Donations and Expenses
date_range Published 12 Dec 2025
Download now (PDF 944 KB) get_appTUPOU Gabriel Return of Electoral Donations and Expenses
date_range Published 12 Dec 2025
Download now (PDF 267 KB) get_appWOOLF Simon Return of Electoral Donations and Expenses

date_range Published 12 Dec 2025
Download now (PDF 5.8 MB) get_appGet in touch
- Phone:
- 0800 496 734
- Email:
- info@gw.govt.nz