A brief summary of climate and hydrological conditions in the region.
This service is regularly updated during periods in which closer monitoring is required (regardless of time of the year), in recognition that there is potential for dry spells, or irregular hydrological recharging. It does not define an official council position on drought or drought declaration. Outside of dry periods, less frequent updates synchronise with our latest seasonal outlooks.
Updated 27 March 2026
Next update due when there is a significant change of conditions or a new seasonal outlook.
Background
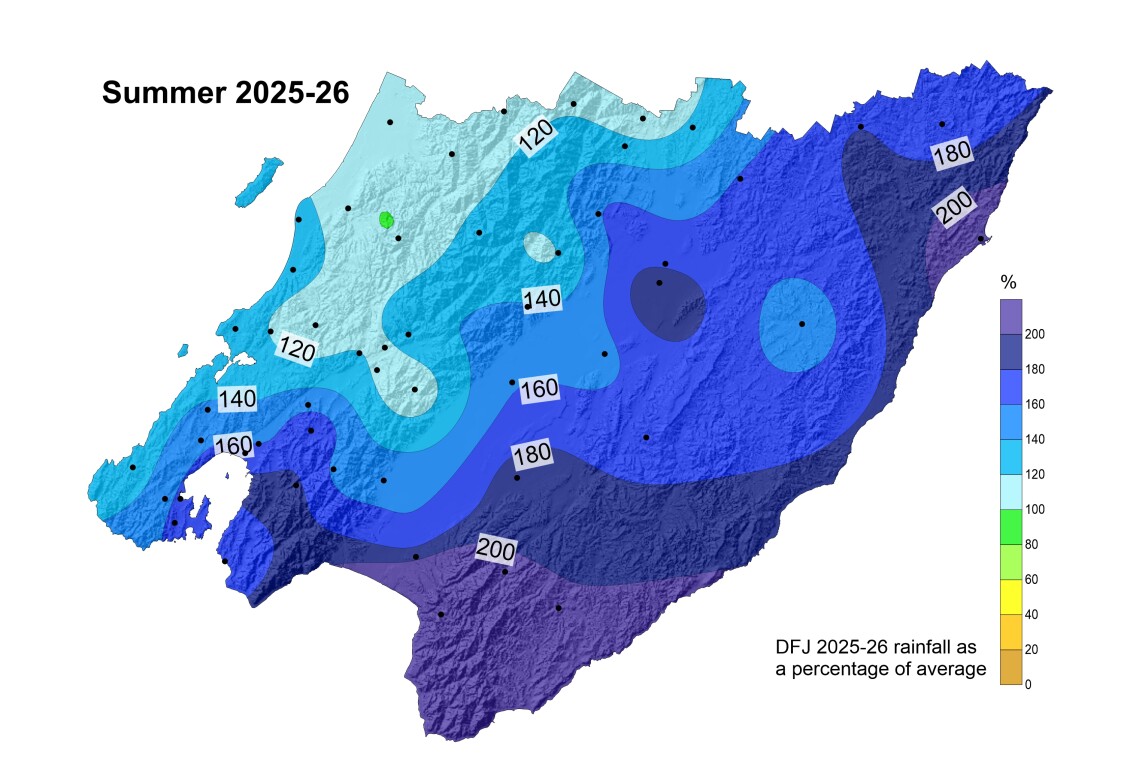
Summer 2026 was dominated by a La Niña with easterly flows, and strong wind gusts associated with severe weather events. A subtropical low in mid-February approached the east coast from the north and caused significant damage on the southern coast and north of Wellington towards the Hutt valley. It was a much wetter than normal season with about twice the long-term average rain on the southern and eastern parts of the region. Temperatures were also well below average in the Wairarapa, with less evaporation than normal and a greener landscape compared to regular summers.
Current situation
Soil moisture levels were sitting at the above average mark around the autumn equinox, without any apparent area of significant deficit throughout the region. Thanks to a very wet summer, the cumulative rainfall from mid-December onwards placed most of the Wairarapa at similar hydrological recharging levels to the La Niña of 2021-2022 at the closure of summer. Groundwater levels are generally holding up and tracking well within the historical normal range for early to mid-autumn. Some Wairarapa rivers and streams were receding towards restriction levels due to a lack of rainfall in the second half of March. However, any extended period of restriction going forward will be much less consequential than if it occurred earlier in summer.
Meteorological outlook
International climate models are predicting that La Niña will continue to die off during autumn, with some lingering effects and a moderate likelihood of further easterly events and subtropical disturbances. At the same time, climate models are now giving a strong indication of a reversal back to the positive ENSO phase, with a new El Niño likely developing into winter. We will be monitoring this development, and the potential dryness that could be associated with it later this year.
Climate change
The ‘normal’ longer-term water balance is becoming increasingly hard to maintain quite possibly due to climate change influences, and increased high frequency climate variability, with more unreliable weather patterns. Droughts are expected to become more severe and frequent in the Wellington region, particularly in the Wairarapa. Even if international climate policy efforts were to successfully contain global warming under 1.5-2 degrees (the Paris Agreement’s ambition), it is important that we enhance our water resilience and be prepared for more unreliable climate patterns with both extreme dry and extreme wet periods. We note that the warming of the land also means that evapotranspiration will greatly increase, so the soil will likely need more ongoing rain to maintain ideal moisture levels, compared to what it has needed in the past.
View the latest national drought index state
View the national drought forecasting dashboard
View the latest seasonal report:
Climate drivers and seasonal outlook for the Wellington Region - Summer 2025-26 summary Autumn 2026 outlook
date_range Published 26 Mar 2026
Download now (PDF 1.6 MB) get_appBrowse the data
Anomaly Maps
How different has recent rainfall/soil moisture been compared with the same time in previous years?
Site-specific graphs
| Area | Rainfall | Soil Moisture |
| Kapiti Coast (lowland) | Otaki at Depot | |
| Kapiti Coast (high altitude) | Penn Creek at McIntosh | |
| Porirua | Horokiri Stream at Battle Hill | |
| Wellington City | Kaiwharawhara Stream at Karori Reservoir | |
| Hutt Valley (upper catchment) | Hutt River at Kaitoke Headworks | |
| Upper Hutt | Upper Hutt at Savage Park | Upper Hutt at Savage Park AQ |
| Wainuiomata | Wanuiomata River at Wainui Reservoir | |
| Wairarapa (high altitude) | Waingawa River at Angle Knob | |
| Wairarapa Valley (north) | Kopuaranga River at Mauriceville | |
| Wairarapa Valley (Masterton) | Ruamahanga River at Wairarapa College | Wairarapa College AQ |
| Wairarapa Valley (south) | Tauherenikau River at Racecourse | Tauherenikau River at Racecourse |
| Wairarapa (north-eastern hills) | Whareama River at Tanawa Hut | Whareama River at Tanawa Hut |
| Wairarapa (south-eastern hills) | Waikoukou at Longbush | Waikoukou at Longbush |
Get in touch
- Phone:
- 0800496734
- Email:
- info@gw.govt.nz