Dramatic fall in region's air pollutants during first week of lockdown
Greater Wellington Regional Council has released details on air quality for the first full week of lockdown showing dramatic falls in pollutants across the region.
Greater Wellington routinely measures levels of air pollutants from traffic at two monitoring stations to check that air quality meets the guidelines and standards set to protect human health.
Air pollution from traffic emissions measured at its Wellington City station from 26 March to 1 April dropped by 72% as a weekly average compared to the same period over the previous four years (2016-2019). Levels measured at its Upper Hutt station, which are usually much lower than Wellington City, fell by 63%.
Thomas Nash, chair of Greater Wellington's Climate committee says "Shutting down our towns and cities and confining everyone to quarters is definitely not the way to tackle pollution and climate change. The effects of this shutdown are severe and they are not being felt equally within our communities. Let's hope we can get out of the lockdown safely and swiftly."
"At the same time, when we start to rebuild, we should remember what happens when we drive less, consume carefully and live locally. The air becomes cleaner, as this new data shows. The waters around us revive, with a rare sunfish visiting Wellington last week. Crucially, our emissions plummet."
"The challenge now is to restart our economy without greatly restarting emissions. At Greater Wellington we're determined to use all the tools in our quite considerable toolbox to reshape this region so that it is climate-safe and fit for purpose in the 21st century," adds Cr Nash.
Greater Wellington uses nitrogen dioxide measurements to track long term trends in emissions. Lower levels of nitrogen dioxide also means lower levels of CO2 as both gases come from the same source; vehicle exhausts.
Black carbon levels, an indicator of traffic particulate matter - especially diesel vehicles, measured at Wellington city fell by 63%.
Greater Wellington is also developing an indicator that tracks long term levels of nitrogen dioxide to evaluate the real-world impacts of changes to emission standards and people's travel patterns on the level of emissions and people's exposure to harmful traffic pollutants.
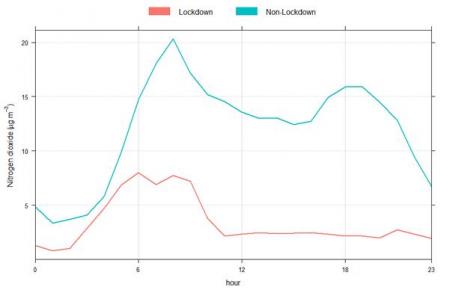
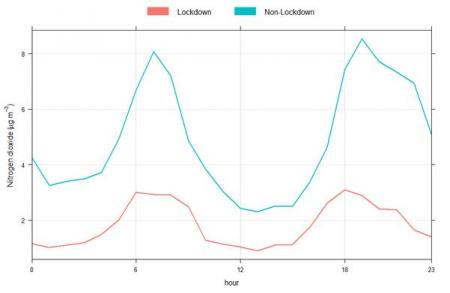
Levels of nitrogen dioxide measured by Greater Wellington meet the national environmental air quality standard. The following graphs shows nitrogen dioxide levels for each hour over the day, starting at midnight, for the first week of lockdown (red) compared the average for the same week from 2016 to 2019 (blue).
Graph 1: Wellington central monitoring station.
Graph 2: Upper Hutt monitoring station.
Get in touch
- Phone:
- 0800 496 734
- Email:
- info@gw.govt.nz