Plot sampling
Vegetation, birds and pest animals were monitored during late spring to early autumn at sites located at or close to each of the points on the 8km x 8km grid. Sites were sampled as shown in Figure 1, following DOC monitoring procedures (Department of Conservation 2016, 2018). Site descriptions were recorded with the intention of revisiting sites on a five-year cycle.
Vegetation monitoring
At each site the sampling team established a permanently marked 20m x 20m vegetation plot, divided into 16 (5m x 5m) subplots (Figure 3). In each vegetation plot all the trees and tree ferns (>2.5cm Diameter at Breast Height [DBH]) were tagged and had their diameters recorded. The exception to this was in production forests, where trees were measured but not marked as there was a concern that marking trees could influence the management at the site. Saplings (>1.35m and <2.5m tall) were counted for each species in the plot. Circular understory plots (0.5m radius) were positioned halfway along the boundaries of the subplots that lay within the 20m x 20m plot boundary. This gave 24 (0.8m2) understory plots in which all species <1.35m tall were counted (Department of Conservation 2018).
Bird monitoring
Bird counts were conducted at five stations at each site, one in the south western corner of the 20m x 20m vegetation plot and the other four 20m off the ends of each of the possum monitoring transects as shown in Figure 1. This is a slight deviation from the DOC protocol where the count station is monitored from the centre of the plot, not the corner. This deviation was instituted to reduce disturbance to the plot and represents a difference of ~14m. This difference was not considered to be influencing the count given that birds are being recorded from a radius of ~200m. Bird counts were conducted as two sets of five minute counts at each count station, the distance to the bird being recorded in the second set of counts (Department of Conservation 2016). Sets of counts were repeated twice at each station to record 10 five-minute bird counts and 10 five-minute distance bird counts at each site.
Possum monitoring
Possum monitoring transects (each 200m long) were laid out at 45° angles from each of the corners of the 20m x 20m vegetation plot (Figure 4). Ten chew cards were placed on trees or 5mm aluminium rods 20cm-30cm above the ground, starting 20m from the corner of the plot and spaced at 20m intervals along each of these four possum monitoring transects (i.e. 40 cards per site). The chew cards were constructed from a 9cm x 18cm rectangle made of 3mm white plastic coreflute, loaded with aniseed flavoured possum dough. In accordance with the DOC protocol, cards were left out for one dry night and the bite marks on cards identified to determine the relative abundance of pests (Department of Conservation 2016).
Initially, DOC used leg-hold traps for possum monitoring. These were however not an option in production landscapes where livestock may be injured. DOC converted to chew cards at all sites in the second season as these were considered easier to deploy (Forsyth et al. 2015).
GWRC used wax tags for possum monitoring in its first two seasons of monitoring but included chew cards from its second season. GWRC then discontinued using wax tags and continued with chew cards in its third season. The wax tags were not placed on the lines off the corners of the vegetation plot as per the protocol, but were run as four lines of ten wax tags each, spaced at 20m intervals, in the nearest wooded areas. Wax tag lines were not sampled if there were no wooded areas close by, and fewer lines were sampled if there was not enough wooded area in which to establish all four lines. The chew cards were used in all habitats. Although used primarily to monitor possums, the chew cards also recorded the presence of rats and mice.
Ungulate & lagomorph monitoring
Ungulate pellet density transects (each 150m long) were established parallel to the possum monitoring transects off the corners of the vegetation plot, spaced 3.5m apart. The ungulate pellet density transects started at the next sub-plot corner clockwise around the vegetation plot from the possum monitoring transect (Figure 4). Each line consisted of 30 quadrats, spaced at 5m intervals (i.e. 120 quadrats per site). Each quadrat had a 1m radius (3m2) in which all ungulate dung pellets were recorded. Nested within the centre of this 1m radius quadrat was an inner subquadrat with a 0.18m radius (0.1m2) in which all hare and rabbit pellets were counted. In the first season the GWRC sampling team realised that they could not reliably distinguish deer and goat pellets, so these were combined in the monitoring results described here (Department of Conservation 2016). Unlike the DOC sampling teams that surveyed primarily in natural landscapes, the GWRC sampling team sampled extensively in livestock production landscapes. Consequently, the GWRC sampling team found it necessary to record livestock dung and pellets separately to that of deer and goats, while these were combined in the ungulate counts by DOC.
Plot layout and transect diagrams
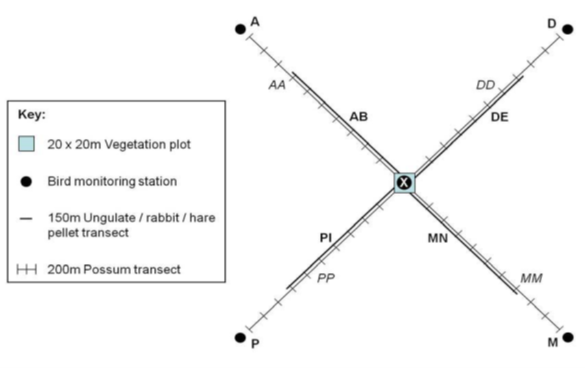
Figure 1
Monitoring layout for vegetation, pests and birds at each monitoring point.
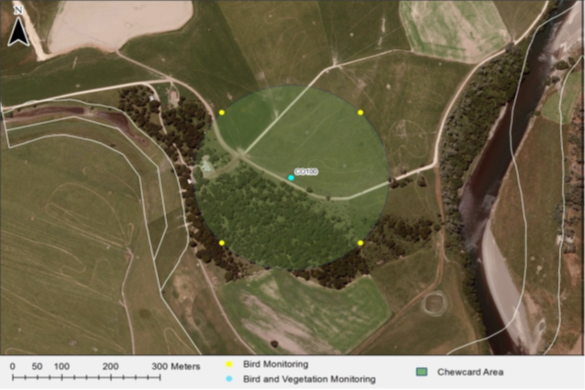
Figure 2
Example of a plot layout in a production landscape.
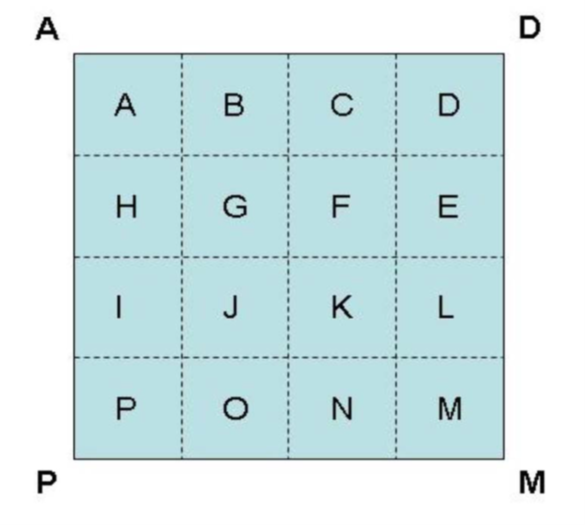
Figure 3
Outline of 20m × 20 m vegetation plot, illustrating the labelling system used to identify each corner of the plot and each of the 16 (5m × 5m) subplots within it.
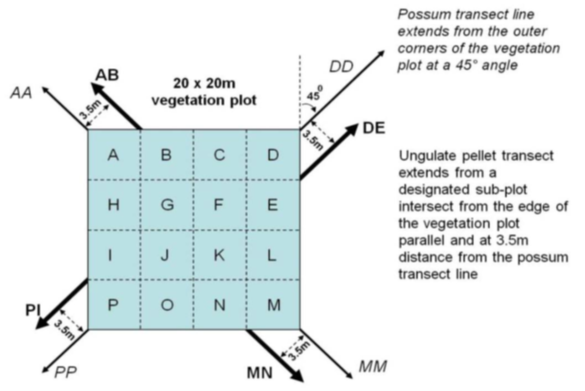
Figure 4
Location of possum transect lines in relation to pellet transects and the vegetation plot layout.