Major ion chemistry
Groundwater chemistry is commonly dominated by the major cations calcium, magnesium, potassium and sodium, and the major anions bicarbonate, chloride and sulphate. These ions are derived from soil, rocks and minerals in the aquifer as water passes through them, as well as from anthropogenic sources such as fertilisers, and human and animal wastes.
Chloride has a drinking water aesthetic value of 250 mg/L, above which it may have noticeable taste (Taumata Arowai, 2022). See the LAWA chloride factsheet for more information. High chloride concentrations can also cause corrosion of metal water pipes and plumbing fittings. Sodium and sulphate have taste thresholds of 200 mg/L and 250 mg/L respectively (Taumata Arowai, 2022). Calcium and magnesium are the main components of water hardness. High hardness (<200 mg/L) can cause scale deposition in plumbing and pipe work, while low hardness (<100mg/L) can be a cause of corrosion. High hardness may also have noticeable taste.
Using site median concentrations of these major ions, sites have been assigned into groups of similar chemical make-up using hierarchical cluster analysis (HCA). These groupings reflect recharge sources (river vs rain), land use, aquifer geology, location and the length of time the water has been underground. The range of concentrations for each group are shown in the box plot below. For a full description of the HCA technique and and more in-depth analysis of groundwater chemistry in the Wairarapa see Daughney et al. (2009) . Zoom in or hover over the chart for more detail.
Map usage: Drag and scroll on the map to move and zoom in on areas of interest, click on a site symbol to see more information. and subset the table below to that specific site, and use the selection box on the map ( ) to subset table data to sites in that area.
Table usage: Click on the +/- button at the end of a row to see the raw sample data and highlight that site on the map above. Click on table headers to sort the data by that column – holding the shift key allows sorting over multiple columns.
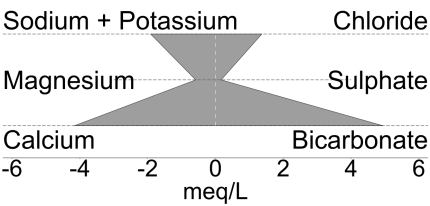
Sites on the map are presented in the form of Stiff plots, which are a graphical representation of the cation and anion make-up of the water sample. This allows quick assessment of similarities in groundwater chemistry across the region. The shape of the plots are defined in milliequivalents per litre, which are a function of the concentrations, the molar mass of each component and their respective ionic charges. Water types shown in the map pop-ups describe the dominant ionic constituents of the groundwater at each site.